
By the FlowUP team, gaming PC builder in Genappe (Belgium) · Updated 28 September 2026
In brief: to test your PC’s performance, run a free benchmark matched to what you want to measure: 3DMark (Steel Nomad or Time Spy) for the graphics card and the game, Cinebench 2024 for the processor, CrystalDiskMark for the SSD, and the built-in benchmark in your games for real FPS. Then compare your score with that of an identical setup: a difference of more than 10% often points to a driver, temperature, or setting issue.
Test your PC performance: the short answer
A PC score only makes sense when you compare it to something: an identical setup, your own score from before, or the FPS you expect in a game. The goal isn’t to get the biggest number, it’s to check that your PC delivers what it should, and to spot the component that’s holding it back.
The method has three steps: identify the hardware, run a benchmark for each component, then compare and interpret. Allow about half an hour, with the PC plugged in and applications closed.
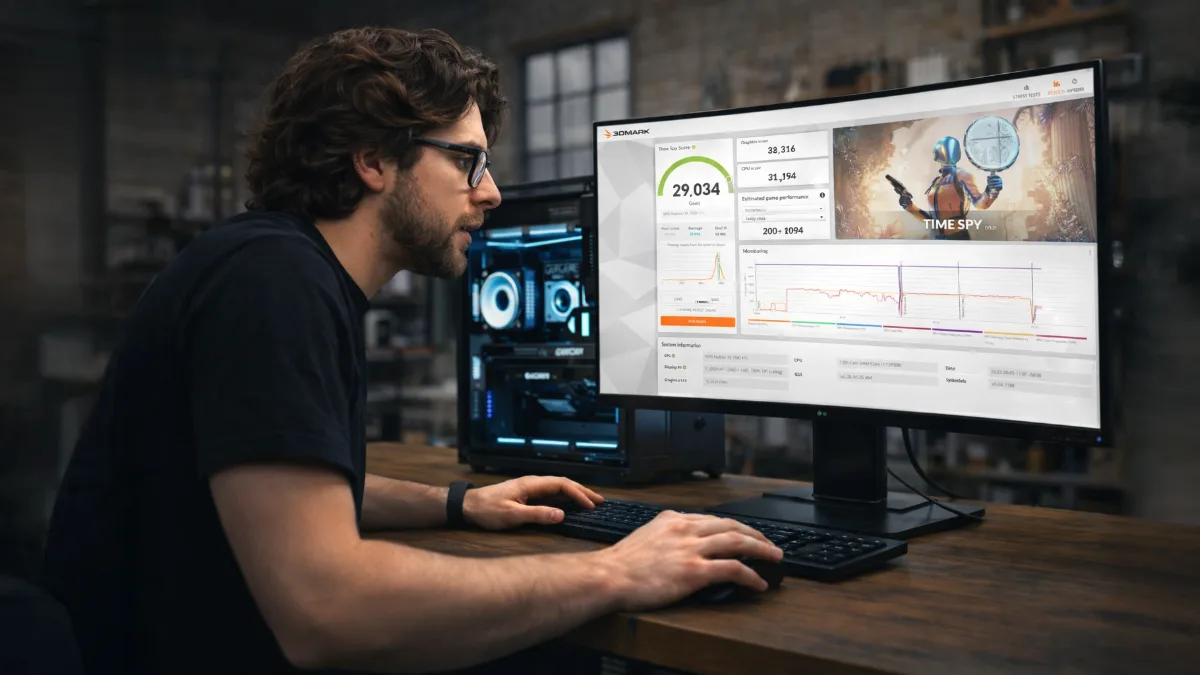
A score only matters when compared with an identical configuration.
Step 1: identify the hardware in your PC
Before testing, write down exactly what’s in your PC. The Task Manager (Performance tab) shows the processor, RAM, storage and the graphics card. For more detail, CPU-Z shows the memory frequency and checks whether dual-channel is enabled, and GPU-Z shows the exact graphics card and its driver version.
While you’re at it, check two settings that often skew the results: the memory should run at its rated frequency (XMP- of EXPO-profiel... XMP or EXPO enabled), and the graphics driver should be recent (…update your drivers).
Step 2: the free benchmarks to use
| What you’re testing | Tool | What it tells you |
|---|---|---|
| Graphics card and game | 3DMark (Steel Nomad, Time Spy) | Comparable graphics score, free demo version on Steam |
| Processor | Cinebench 2024 | Single-core and multi-core score, free |
| SSD and drives | CrystalDiskMark | Read and write speeds, free |
| Stability under load | OCCT | CPU, graphics card and power supply tests, with temperature monitoring |
| Real FPS | Benchmark built into the game + MSI Afterburner | The measurement that really matters: average FPS and 1% low |
| Temperatures and frequencies | HWiNFO | Detects overheating that reduces performance |
A few rules for reliable results:
- close the browser, Discord and downloads;
- on a laptop, plug in the charger and choose the performance mode;
- run each test two or three times and keep the average;
- monitor temperatures during the test.
Be wary of “all-in-one” overall scores: they mix very different components and are sometimes weighted in a questionable way. A benchmark per component, then a real game, gives a much more accurate picture.
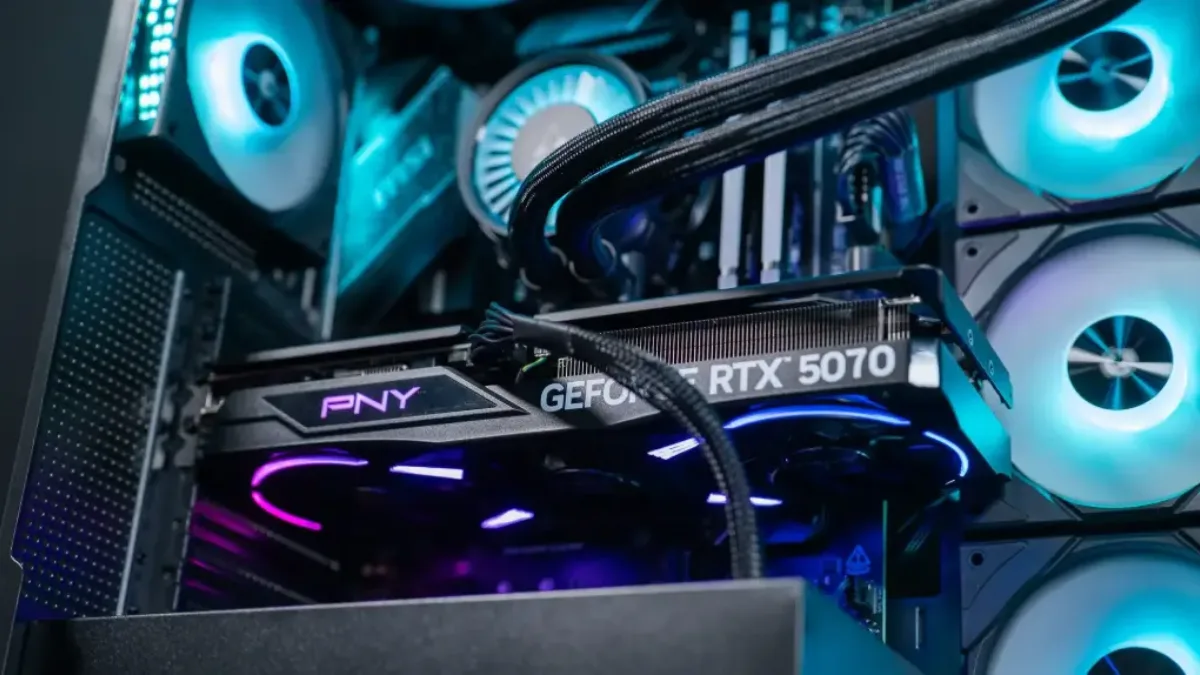
For the graphics card, 3DMark and a real game are better than a single overall score.
Our FrenchHardware channel shows in video how to test a gaming PC upon arrival, step by step:
FrenchHardware, “How to test your new gaming PC”.
And the Windows score (WinSAT)?
Windows hasn’t shown a performance rating for a long time, but the WinSAT tool still exists. Open PowerShell as an administrator, type winsat formal, wait a few minutes, then run Get-CimInstance Win32_WinSAT to display the ratings (processor, memory, graphics, disk). Useful for spotting a very slow drive, but too rough to judge gaming performance, prefer the tools above.
Step 3: interpret the results
Compare your score with that of an identical setup (same processor, same graphics card): the 3DMark and Cinebench rankings make this possible directly. A difference of a few percent is normal. Beyond around 10%, look for the cause:
- high temperatures and frequencies that drop: dust, thermal paste, airflow;
- memory running single-channel or without an XMP/EXPO profile;
- outdated driver or Windows power plan set to power saving;
- imbalance between the processor and the graphics card.
In games, also look at the 1% low: a decent average with very low dips points to stuttering, often related to RAM, storage or temperatures (why is my PC lagging in games).
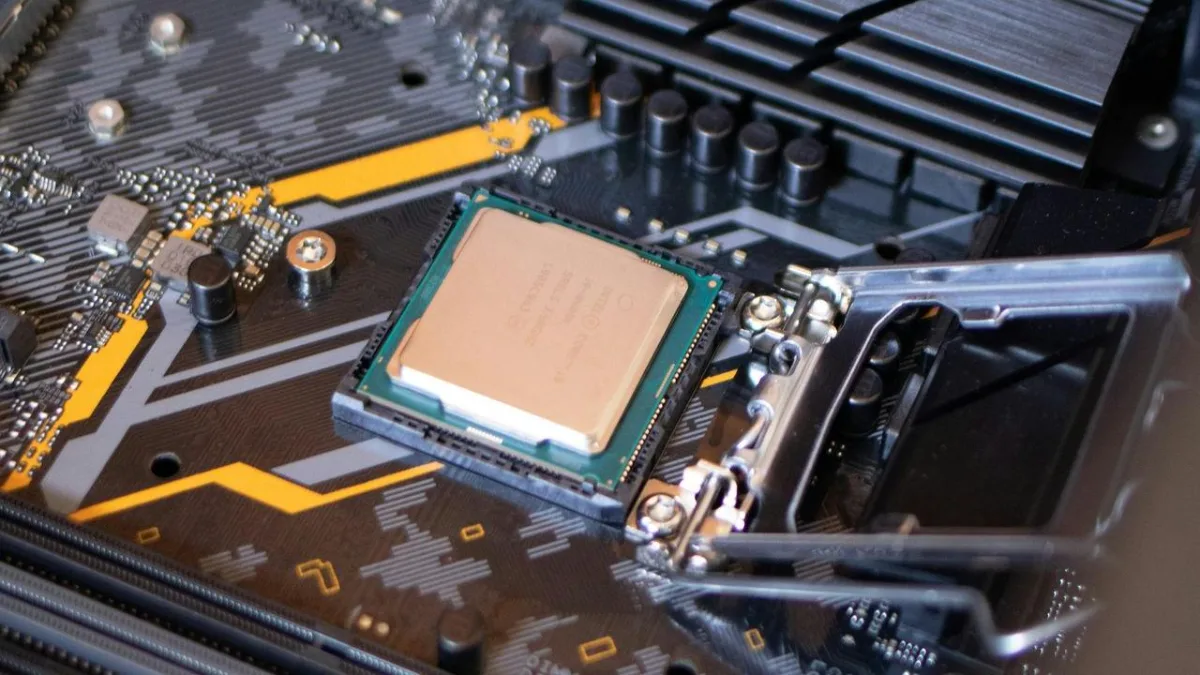
A processor that gets too hot lowers its frequency, the score suffers as a result.
When should you improve or replace your PC?
If your PC hits the expected scores but no longer suffices for your games, the issue isn’t a setting: it’s the hardware. Identify the limiting component. If your graphics card is at 99% in-game, that’s the one you need to change. If it’s the processor that tops out while the graphics card is ready, then it’s that.
When several components have aged at the same time (CPU, motherboard, DDR4 RAM), a complete PC often works out cheaper than a string of upgrades. To choose based on your budget, see our guide to the best gaming PC 2026.
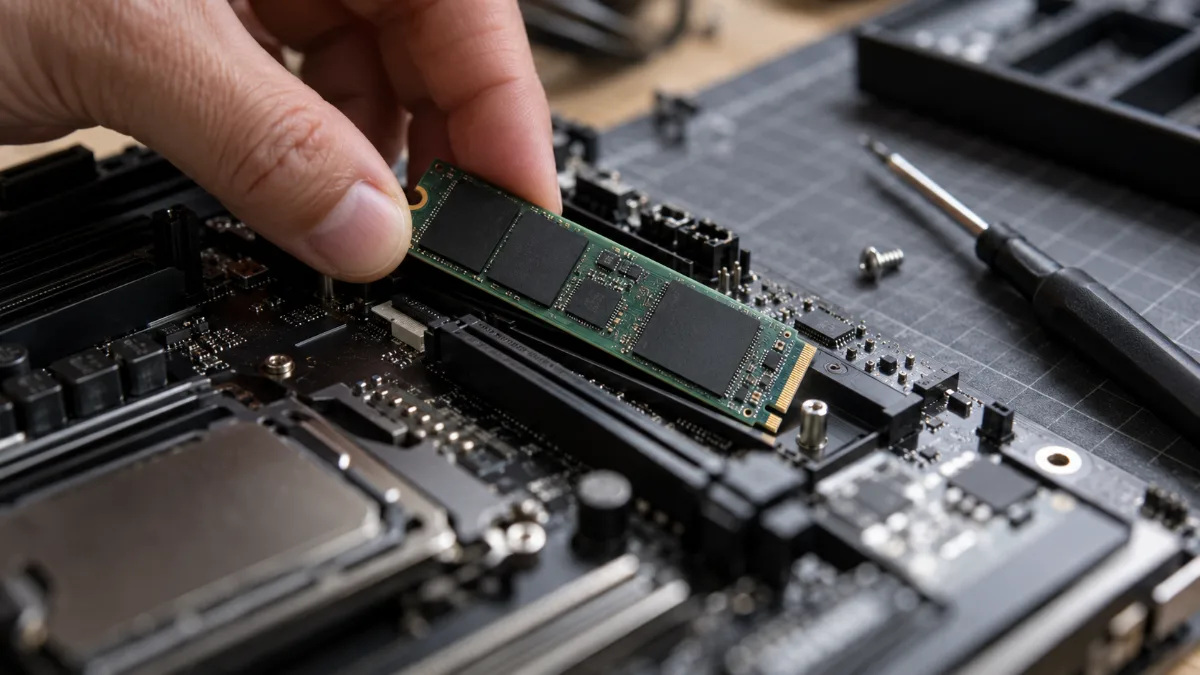
A slow SSD is quickly spotted with CrystalDiskMark.
Our gaming PCs, tested before shipping
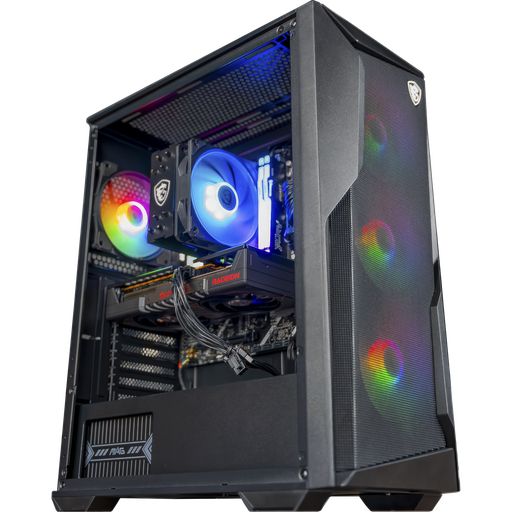
Rift PC, Radeon RX 9060 XT 16 GB
Ryzen 5 7500F, RX 9060 XT 16GB and 16GB of DDR5: a balanced setup for high 1080p and 1440p.
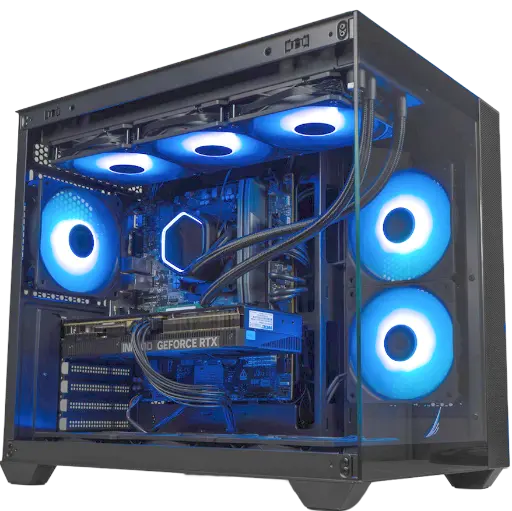
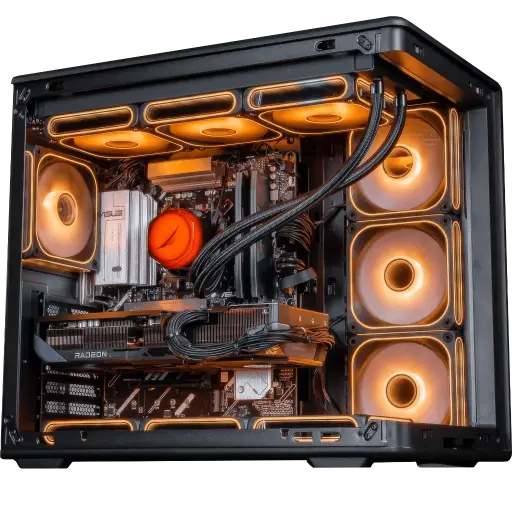
Apex V2 PC, Radeon RX 9070 XT
RX 9070 XT 16GB, Ryzen 7 7800X3D and 32GB of DDR5: for demanding 1440p and big AAA titles.
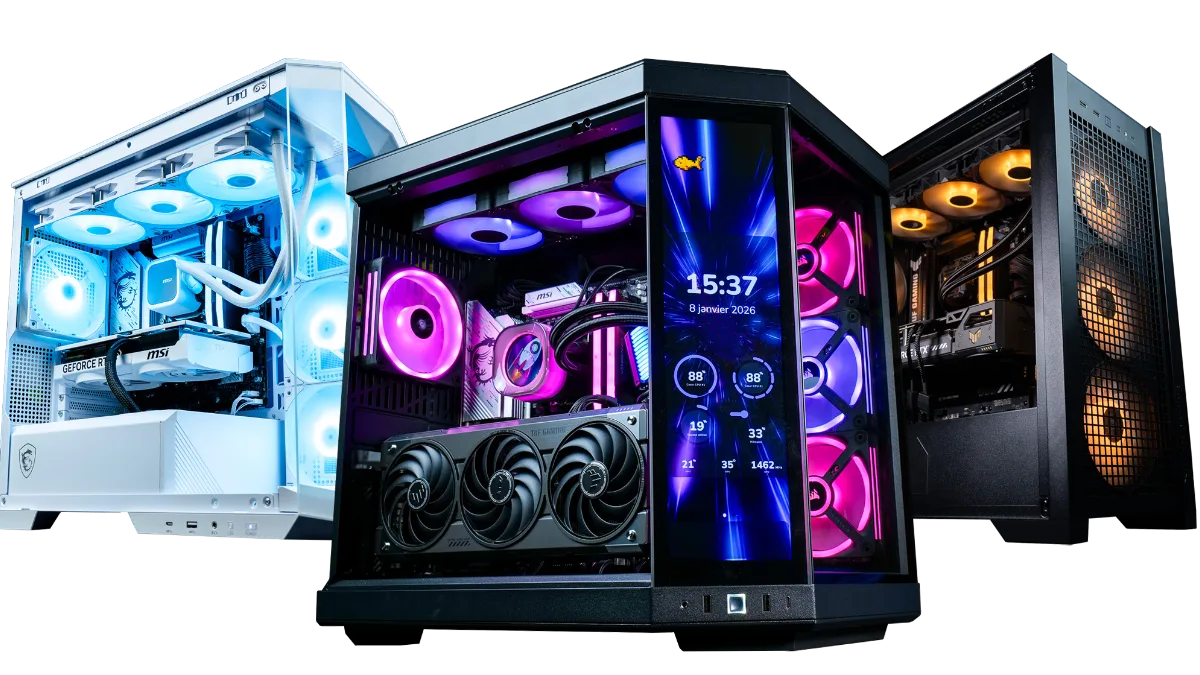
All our configurations are in the category FlowUP gaming PC.
FAQ: testing your PC’s performance
How do I test my PC’s performance for free?
With 3DMark (free demo version) for the graphics card, Cinebench 2024 for the processor, CrystalDiskMark for the SSD, and the benchmark built into your games for real FPS.
What is a good PC score?
There is no such thing as a good score in absolute terms: a good score is one that matches a setup identical to yours. Compare in the tool’s rankings with the same processor and the same graphics card.
How do I find my PC’s score on Windows 11?
In PowerShell as administrator, run winsat formal, then Get-CimInstance Win32_WinSAT. These ratings are quite basic: a benchmark like 3DMark is far more informative for gaming.
Why is my score lower than expected?
Most often because of temperatures, an outdated driver, memory without an XMP/EXPO profile or in single channel, or background applications during the test.
Can benchmarks damage my PC?
No, on a PC in good condition and well cooled. Just keep an eye on the temperatures and stop the test if you notice any abnormal behaviour.
Is UserBenchmark reliable?
It provides a quick overview, but its weighting of results is disputed. For a serious comparison, use a tool per component and test in games.
